Flygut-seq: Cell and region specific gene expression of the fly midgut
Links to flybase:
I. Expression value (rpkm) per cell type
This graph displays the expression value in rpkm for each cell type in the midgut. The
expression values originate from RNA sequencing realized on FACS sorted cell populations from the
midgut.
ISC: intestinal stem cell (delta-Gal4>UAS-GFP), EB: enteroblast (Su(H)-Gal4>UAS-GFP), EC: enterocyte (Myo1A-Gal4>UAS-GFP), EE: enteroendocrine cell (prosperov1-Gal4>UAS-GFP), VM: visceral muscle (how-Gal4>UAS-GFP)
ISC: intestinal stem cell (delta-Gal4>UAS-GFP), EB: enteroblast (Su(H)-Gal4>UAS-GFP), EC: enterocyte (Myo1A-Gal4>UAS-GFP), EE: enteroendocrine cell (prosperov1-Gal4>UAS-GFP), VM: visceral muscle (how-Gal4>UAS-GFP)
| ISC | EB | EC | EE | VM |
|---|
II. Region specific expression per cell type
Combined graphs
This section displays rpkm values for each region and all cell types. The second graph
is only displayed when one gene is searched. All cell types and regions are displayed in one single
graph for easy comparison.
| R1 | R2 | R3 | R4 | R5 |
|---|
Individual Cell types:
These graphs display the expression value in rpkm for each region in each cell type
along the midgut. The expression values originate from RNA sequencing realized on FACS sorted cell
populations from dissected regions of the midgut.
ISC: intestinal stem cell (delta-Gal4>UAS-GFP), EB: enteroblast (Su(H)-Gal4>UAS-GFP), EC: enterocyte (Myo1A-Gal4>UAS-GFP), EE: enteroendocrine cell (prosperov1-Gal4>UAS-GFP), VM: visceral muscle (how-Gal4>UAS-GFP)
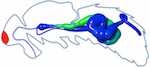
Regions are ordered from anterior (R1) to posterior (R5) and described elsewhere (Buchon et al, 2013, Cell reports).
ISC: intestinal stem cell (delta-Gal4>UAS-GFP), EB: enteroblast (Su(H)-Gal4>UAS-GFP), EC: enterocyte (Myo1A-Gal4>UAS-GFP), EE: enteroendocrine cell (prosperov1-Gal4>UAS-GFP), VM: visceral muscle (how-Gal4>UAS-GFP)
Regions are ordered from anterior (R1) to posterior (R5) and described elsewhere (Buchon et al, 2013, Cell reports).
| R1 | R2 | R3 | R4 | R5 |
|---|
| R1 | R2 | R3 | R4 | R5 |
|---|
| R1 | R2 | R3 | R4 | R5 |
|---|
| R1 | R2 | R3 | R4 | R5 |
|---|
| R1 | R2 | R3 | R4 | R5 |
|---|
III. Fold induction after Pe infection
This graph displays the fold enrichment for each gene in each cell type in response to
infection with the entomopathogenic bacteria Pseudomonas entomophila (Pe). The values originate from RNA
sequencing realized on FACS sorted cell populations from whole midguts either unchallenged or infected
with Pe. Flies were starved for 2 hrs and then infected for 48hrs with P.entomophila bacteria on
filter paper. Cell populations were then isolated using FACS (based on size and cell type specific
marker expression).
non-blue histograms: the value for those columns does not represent actual fold induction.
Red histogram: the gene is either switched on or its gene expression upon infection is multiple log higher than in basal condition
Green histogram: the gene is either switched off or its expression upon infection is multiple log lower than in basal condition.
Red histogram: the gene is either switched on or its gene expression upon infection is multiple log higher than in basal condition
Green histogram: the gene is either switched off or its expression upon infection is multiple log lower than in basal condition.
| ISC | EB | EC | EE |
|---|